Implications of the Variety in State Response to COVID-19

One is how different states reacted differently to the virus. The other is how the nation’s reliance on the states has affected the nation’s response.
Since the first days of the virus, the states have had the lead. In part, this is because, like all major emergencies, the virus began as a local issue, with cases flaring in a Seattle nursing home and other cases emerging in California. Local public health officials were on the front lines of battling a strange new enemy whose dimensions were dangerous but puzzling.
Just how did the states respond to this challenge? The answer: in very different ways and, especially, on very different timelines. Some of that flows from the pace at which the virus erupted across the country, which flared fiercely in different places at different times. And some of that stems from very different policy environments in different states.
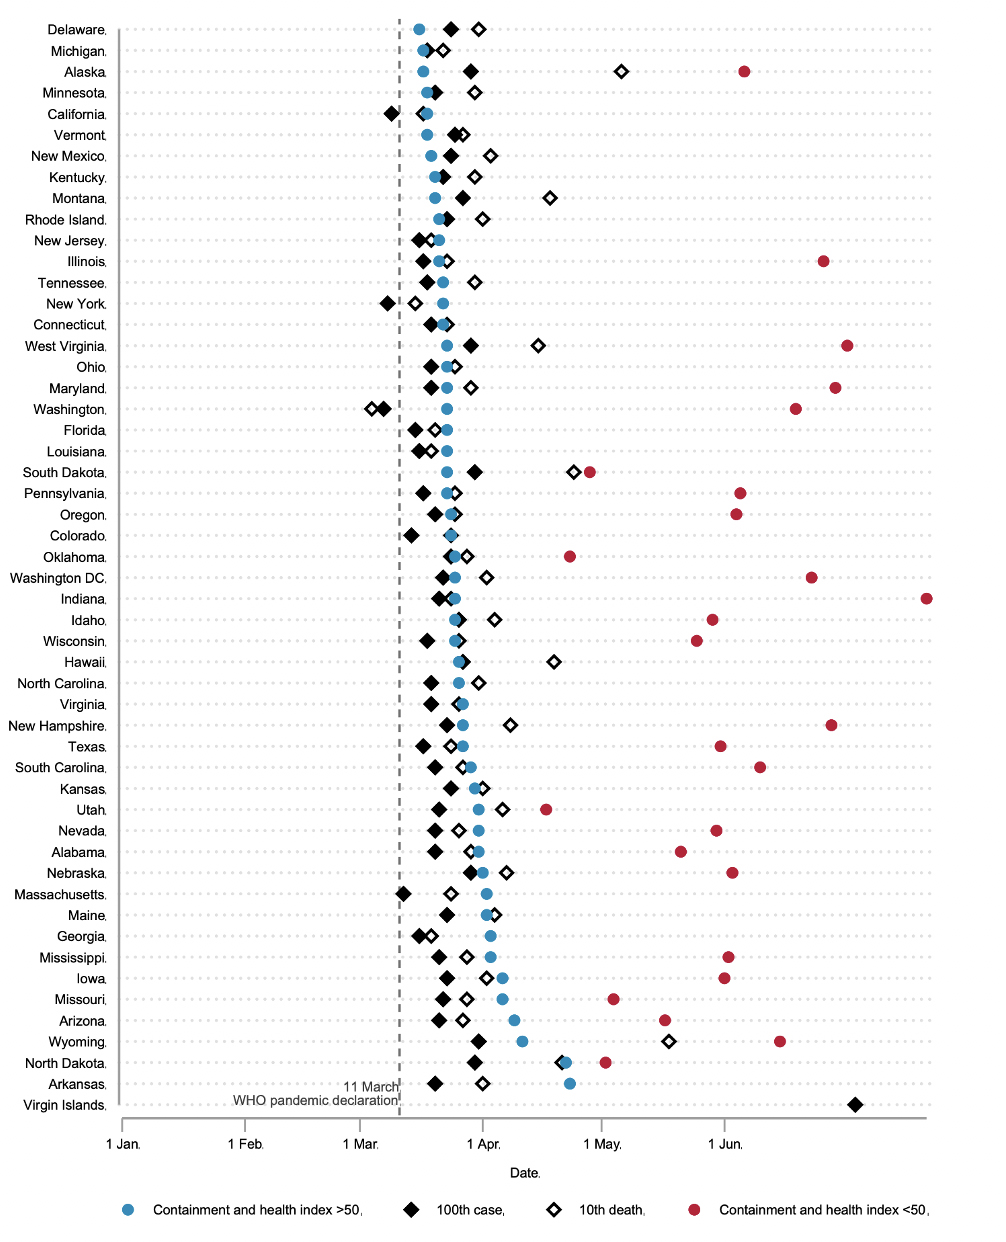
The following figure, produced by a team of scholars at the University of Oxford that has assembled one of the most comprehensive analyses of governments’ response to the virus around the globe, charts the important elements of the virus among the states: the beginning and severity of the outbreak (measured by when time when a state reached its 100th case, and then when a state reached its 10th death); and the strategy the states advanced (measured by Oxford’s 100-point sale “stringency index” —the degree to which state governments create tough mask and stay-at-home rules, when the rules are created, and when they are eased).
Cases popped up first in Washington, California, and New York, and then developed at different rates across the country. But the stringency of state policies did not directly follow from the spread of the virus. The timing and severity of the virus was often out of sync with state policy responses.
The point at which states reached a stringency index score of 50, plotted alongside dates of their 100th confirmed COVID-19 case and 10th confirmed COVID-19 death:
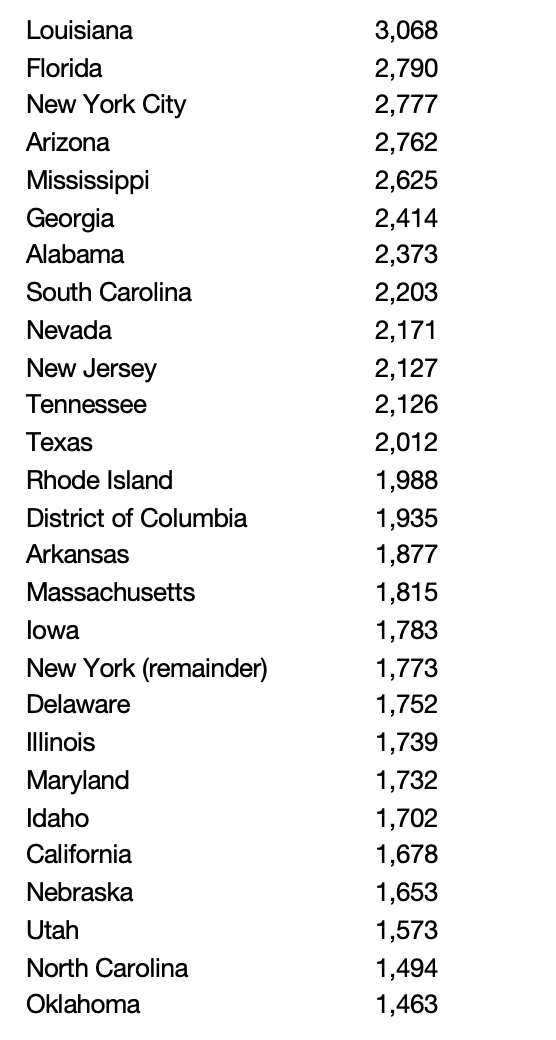
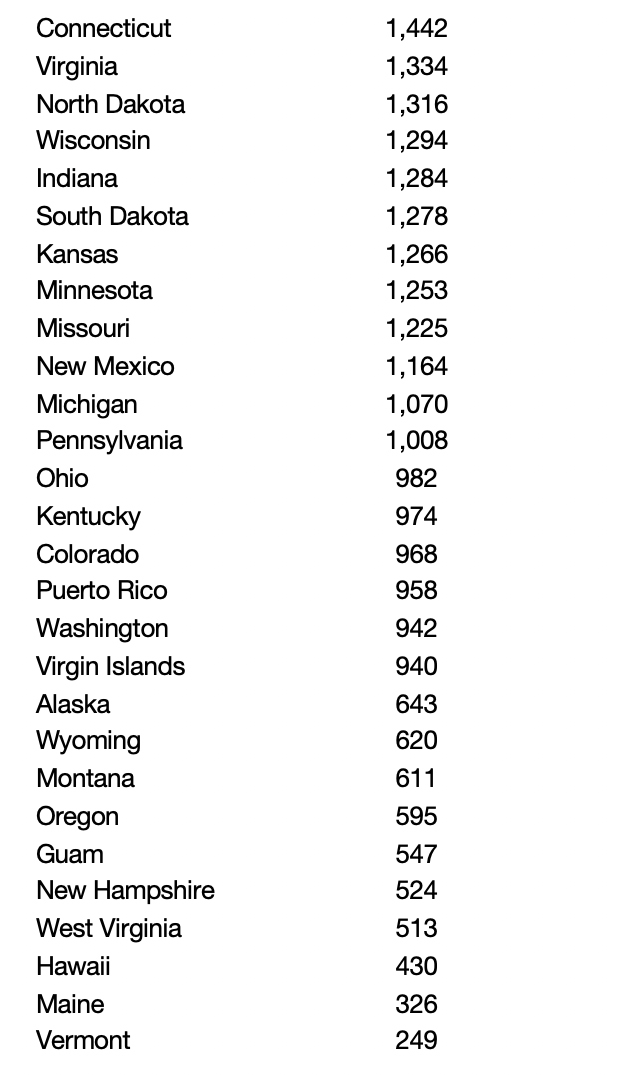
Case rate varied widely by state
| State | Cases/ 100,000 population | State | Cases/ 100,000 population |
|---|---|---|---|
Source: CDC COVID Data Tracker. Case rate as of August 24, 2020.
State decisions, in fact, were deeply rooted in ongoing policy debates. For example, 32 states issued lockdown decisions during March, compared with 18 states that locked down later or not at all. Of the 32 March lockdown states, 28 had previously decided to expand the Medicaid program as part of the Affordable Care Act. In contrast, of the 18 states that did not lock down in March, 11 had not expanded Medicaid. Moreover, states that locked down in March spent 44.4 percent more per capita, on public health. States’ decisions about how to react to COVID, therefore, did not occur in isolation.
Supreme Court Justice Louis Brandeis celebrated the states as “laboratories of democracy.” In the case of the coronavirus, there was wide variation. But there was little of the experimentation that would come from laboratories. Much of the variation among the states certainly came from the way that the virus spread across the country. This is not to suggest which of the previous policy decisions were superior. Rather, COVID-19 decisions were not made in a vacuum -- they were embedded in a longer-term policy stream, with states that took more aggressive steps on public health issues in the past tending to do the same when the virus erupted.
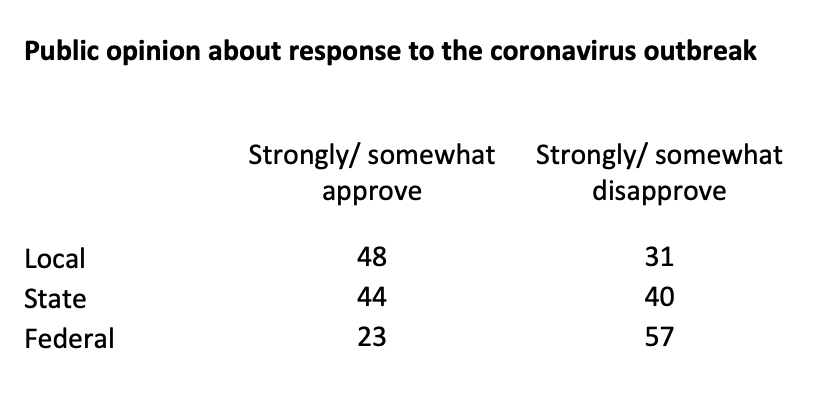
But, overall, members of the public supported the work of their state and local governments far more than the actions of the federal government.
Source: AP-NORC August poll
So the states did indeed react differently, their different reactions were linked only loosely to the spread of the virus itself, and a large part of their reactions were connected to the broader context of previous state policy decisions. At this point of the outbreak, it is difficult to assess just how these differences affected outcomes: We don’t yet know with confidence how much aggressive state action might have reduced the spread of the virus, and how much a state’s less-restrictive actions might have put residents at risk. The implications from those data will take far more time to sort out.
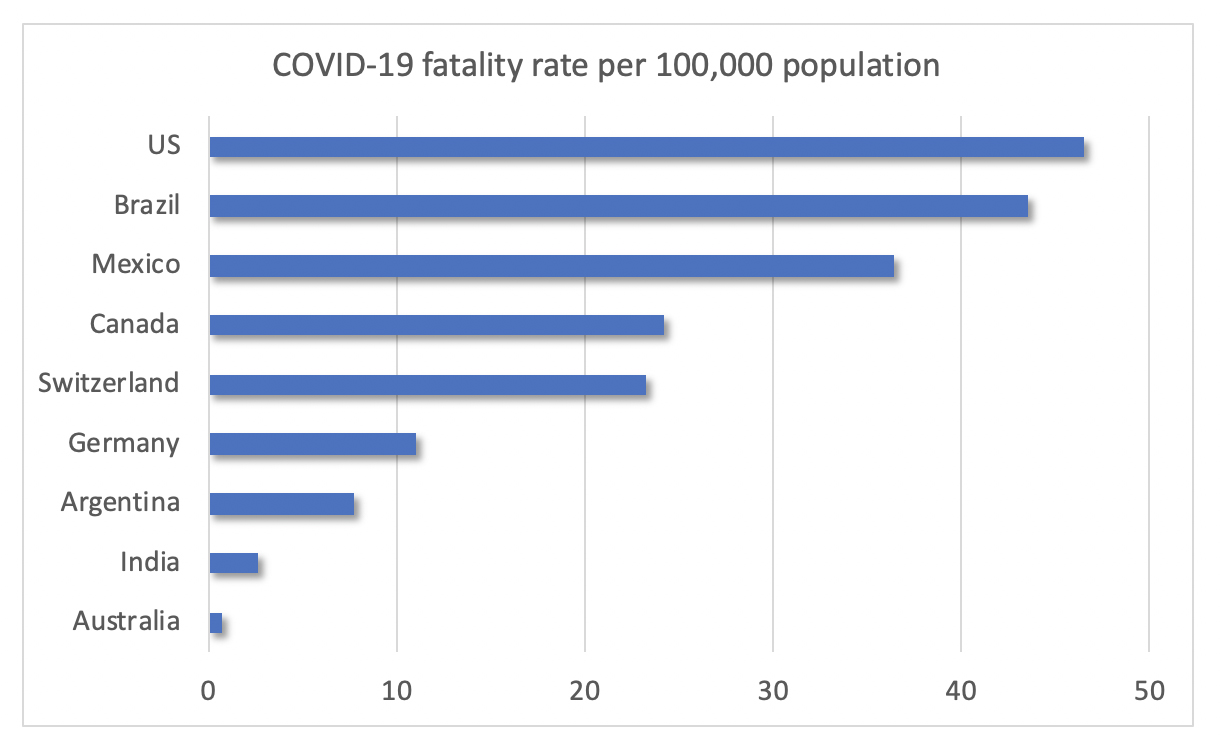
At this point, we can say this. America’s complex federal system has complicated the nation’s response and has created substantial variations in governments’ response across the country. This complexity and variation, moreover, produce data that show the United States had a higher incidence of COVID, compared with to many other countries. I will turn to this issue in a future blog.
For now, however, it’s worth comparing the United States with other countries with federal systems of government. In that comparison, the data show higher incidence in the U.S., as shown in the chart below. And that poses major challenges to governance:
- How much does the response to the virus depend on where citizens live? Are some citizens put at higher risk because of differences in their state’s response?
- As long as America’s national response rests on the decisions of individual states, how will the U.S. compare other countries in addressing the virus?
- How can the nation’s economy as a whole stage a comeback if the actions of individual states put that at risk?
- And, ultimately, do different approaches across the states—and between the states and the federal government—risk further undermining public trust in government’s ability to tackle this—and other—tough problems?
Source: Johns Hopkins Coronavirus Research Center. Fatality rate as of August 24, 2020.


